In 2024, Gold Emerges as a Top Performer, Providing a Strong Tailwind for Newmont
With the gold sector likely to be a potential winner in 2024 (read here), today we look at the world’s largest gold producer Newmont Corporation (NYSE: NEM | TSX: NGT | ASX: NEM) (“Newmont”). Gold is currently trading at US$2,025/Oz (just below its all-time high of US$2,135) with many forecasters tipping it to rise in 2024, especially if we see a rush to safe haven assets due to global instability or a weaker U.S. dollar.
Newmont Corporation owns several tier one gold mines globally
Newmont Corporation is an American company with the world’s leading gold production of 5.956 million ounces of gold produced in 2022. AISC was US$1,211 per ounce.
Newmont’s 2023 guidance is 5.3 million ounces at an AISC of US$1,400 per ounce. The lower 2023 production guidance is attributed to the “strike at Peñasquito, and lower production volumes from non-managed joint ventures (Nevada Gold Mines and Pueblo Viejo) and Ahafo.” The 2023 production downgrade news came in late October 2023 and helps explain the recent stock price fall.
Newmont’s portfolio of mines includes more than half of the world’s tier one gold mines
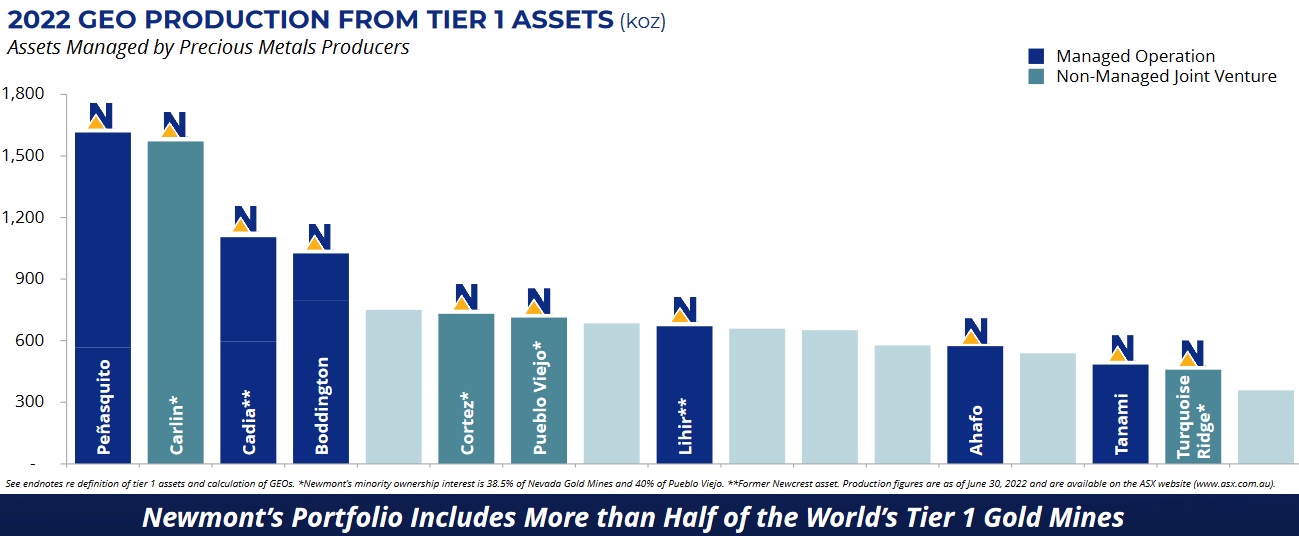
Source: Newmont company presentation
Newmont’s top four producing mines are all producing over 1 million gold equivalent ounces (“GEO”) pa and include:
- Peñasquito Mine (100% owned) – A large polymetallic mine (gold-silver-lead-zinc) in Mexico.
- Carlin Complex (38.5% owned) – Multiple open-pit and underground operations as part of the Nevada Gold Mines LLC JV (38.5% Newmont: 61.5% Barrick) in Nevada, USA.
- Cadia Mine operations (100% owned) – A series of large underground and open-cut gold and copper mines located in the Cadia Valley, NSW, Australia.
- Boddington Mine (100% owned) – A large copper-gold mine located near Boddington in Western Australia. Newmont has introduced a fleet of autonomous vehicles at Boddington, thereby further reducing operating costs.
Newmont’s Boddington Mine in WA is a global tier one asset producing >1Moz of gold equivalent pa in 2022
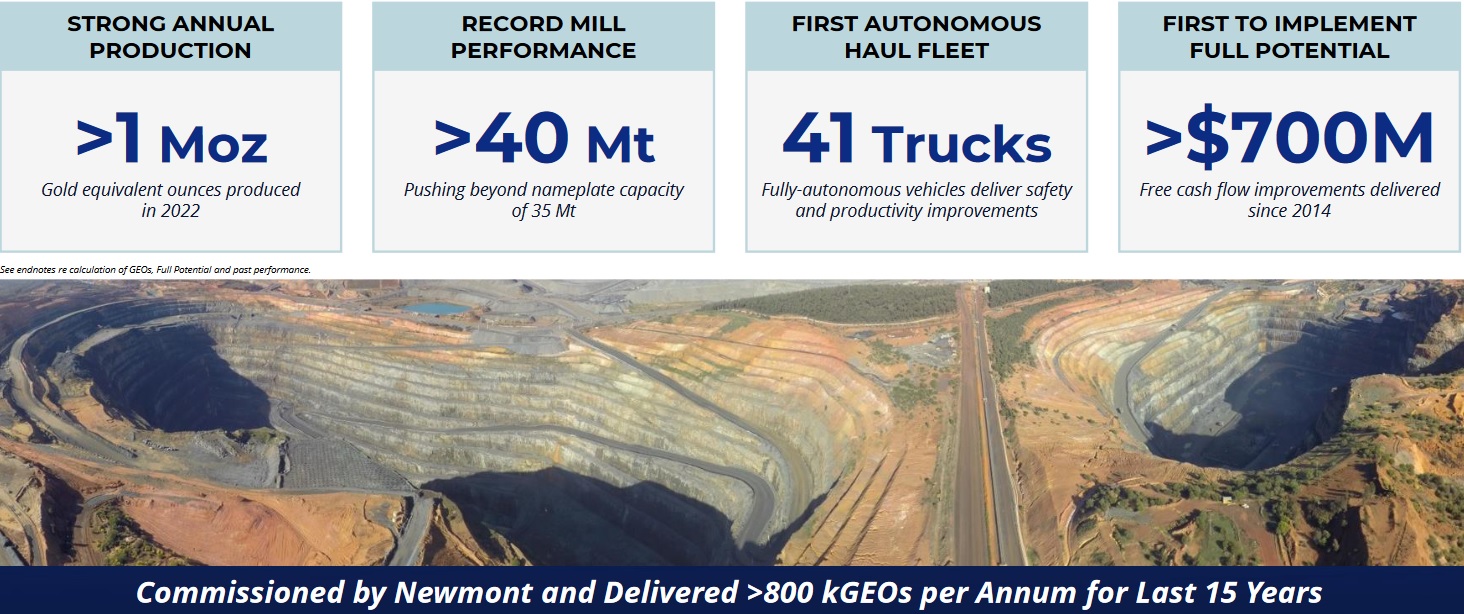
Source: Newmont company presentation
Newmont’s Mines are mostly located in stable mining jurisdictions
Newmont’s gold and copper production comes mostly from the Americas and Australia, with ~80% of Newmont’s mines located in stable mining jurisdictions.
Newmont’s 2/3 gold production is from Tier one assets with 80% of production from stable mining jurisdictions spread across the Americas, Australia, PNG and Africa
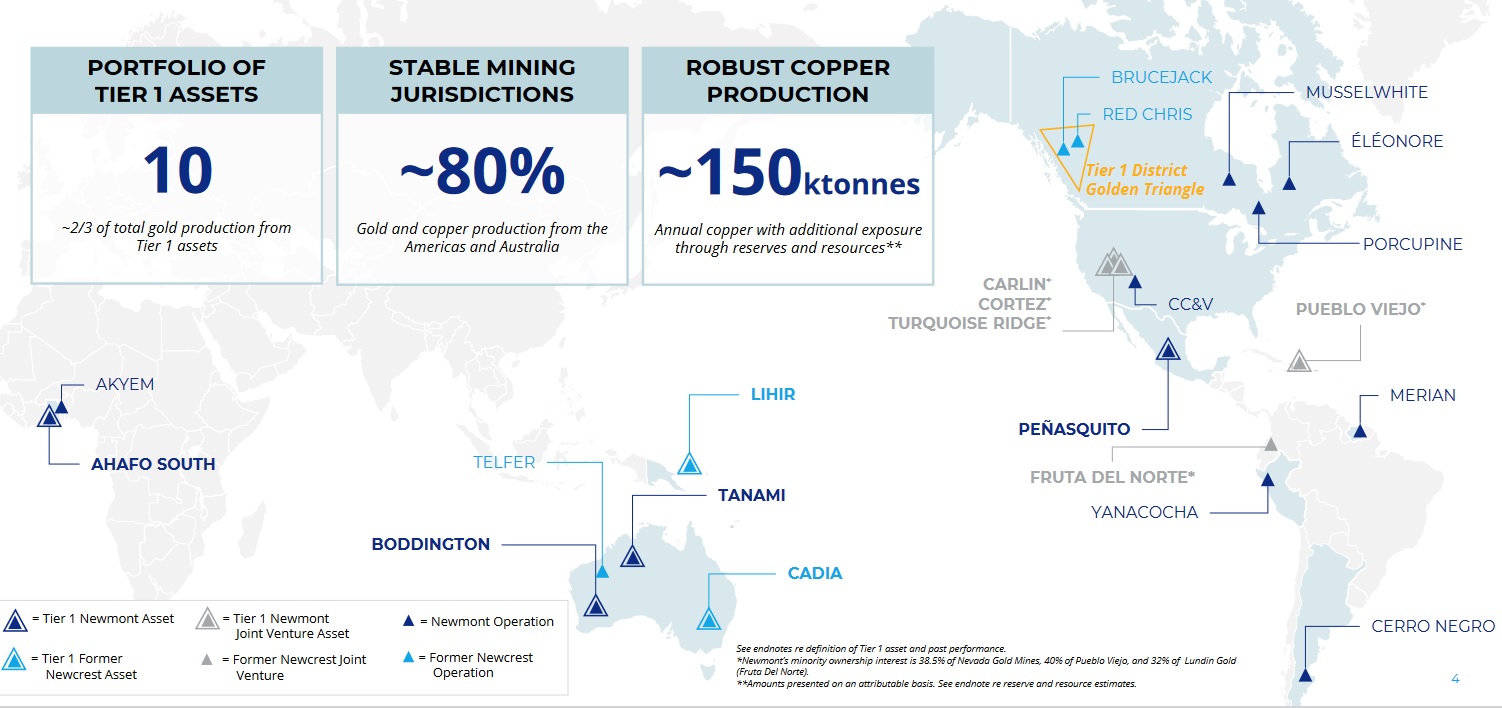
Source: Newmont company presentation
Newmont’s core business strategies include:
- Deliver superior operational execution
- Sustain a global portfolio of long-life assets
- Lead the gold sector in profitability and responsibility
Closing remarks
A potentially stronger gold price in 2024 would be a tailwind for the gold producers. None are bigger than Newmont.
Interestingly, Newmont’s name came from joining the two U.S. locations of ‘New York’ and ‘Montana’. Quite fitting given that Newmont went on to be a huge success built on several large acquisitions (notably the Newcrest Mining acquisition in November 2023).
Newmont has numerous tier one gold mining assets spread mostly across the North and South Americas and Australia with 2023 production results, financials and 2024 guidance set to be announced on February 22, 2024. Current consensus is for 2023 EPS of US$1.28 and for 2024 it is US$2.30. The Newcrest acquisition helps the numbers.
Newmont Corporation trades on a market cap of US$40.75 billion, a 2024 PE of 15.2, and a 2024 dividend yield of 4.34%. Now might be a good time to take a second look at Newmont, especially with their stock price very near a 5 year low.

